
MOVING AVERAGES - The simplest tool that most beginners ignore
Trading King@tradingking
9 days ago
MOVING AVERAGES - The simplest tool that most beginners ignore
Let me break this down because once you understand moving averages, you will never look at a chart the same way again.
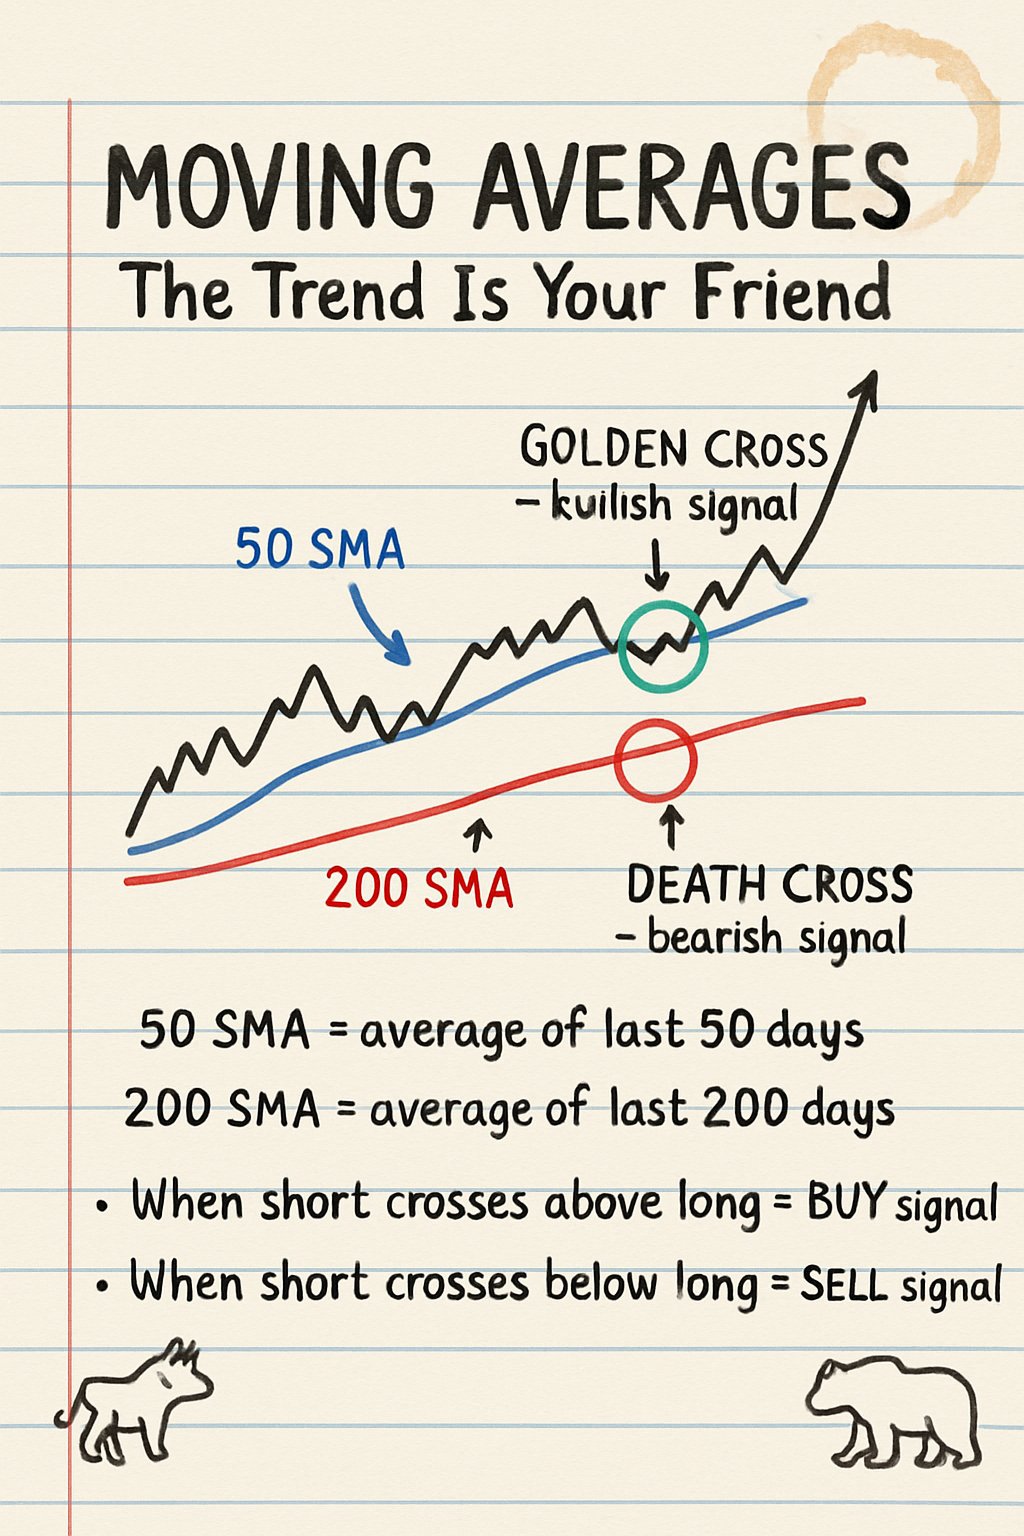
A moving average is just the average price of a stock over a set number of days. That is it. No magic. No algorithm. Just math your calculator can do.
The two that matter most:
50-Day Moving Average (50 SMA) - This shows you the short-term trend. Think of it as the stock's mood this month.
200-Day Moving Average (200 SMA) - This shows you the long-term trend. Think of it as the stock's personality over the past year.
Here is why this matters:
When the 50 SMA crosses ABOVE the 200 SMA, traders call this a Golden Cross. It means short-term momentum is stronger than the long-term trend. Translation: buyers are showing up and they are getting louder.
When the 50 SMA crosses BELOW the 200 SMA, that is a Death Cross. Short-term momentum is dying. Sellers are in control.
Real example: In early 2023, Apple had a Golden Cross around $145. By the end of the year it was trading above $190. The cross did not cause the move. But it confirmed that the trend had changed direction.
PRACTICAL TIP: Do not use moving averages alone. They are lagging indicators - they tell you what already happened, not what will happen next. Use them to confirm your thesis, not to create it.
Think of moving averages as the GPS of trading. They do not tell you where to go. They tell you which direction you are already heading.
Save this. You will need it.
#Learning #Trading #StockMarket #TechnicalAnalysis #MovingAverages #GoldenCross #InvestingBasics #TradingEducation #FinancialLiteracy


8 days ago